Workflows
Introduction
Starting from Kaapana version 0.2.0, the Kaapana platform is equipped with a Workflow Management System (WMS) including a handy Data Upload tool Data Upload and a powerful data inspection tool, Datasets Datasets. The WMS allows the user to interact with the also newly introduced Kaapana object workflow. The workflow object semantically binds together multiple jobs, their processing data, and the orchestrating- and runner-instances of those jobs. In order to manage these workflows, the WMS comes with three components: Workflow Execution, Workflow List and Instance Overview.
Data Upload
There are two ways of getting images into the platform either sending them directly via DICOM (which is the preferred way) or uploading them via the web browser (currently an experimental feature).
Note
When DICOM data is sent to the DICOM receiver of the platform two things happen:
The incoming data is saved to the local PACS
Metadata of the incoming data is extracted and indexed to allow fast filtering and querying via Datasets.
Option 1: Sending images via DICOM DIMSE (preferred)
Images can directly be send via DICOM DIMSE to the DICOM receiver port 11112 of the platform.
If you have images locally you can use e.g. DCMTK.
However, any tool that sends images to a DICOM receiver can be used.
Here is an example of sending images with DCMTK:
dcmsend -v <ip-address-of-server> 11112 (default) --scan-directories --call <dataset-name> --scan-pattern '*.dcm' --recurse <data-dir-of-DICOM-images>
Hint
Option 2: Uploading images via the Web Interface (experimental)
To upload images via the webfrontend, visit the Data Upload wizard page within the Workflows menu of the Web interface. You can upload
arbitrary data here and access and manage it via minio. Additionally you can import uploaded DICOM or NIfTI data into the internal PACS.
Dicom Data
DICOM data should be uploaded in a single compressed zip-file containing folder(s) with DICOM files. The default expected file-extension for DICOMs is
.dcm, but can be configured when triggering the import-dicoms-in-zip-to-internal-pacs workflow.
NIfTI data
NIfTI data will be converted to DICOM data before being imported into the internal PACS. The workflow for converting NIfTI data to DICOM and uploading it to PACS expects the NIfTI data to be structured in one of the following formats. The first format is referred to as the “basic format,” while the second format is the “ nnUnetv2 data format.”
In the basic format, it is assumed that you will place all your images with a unique identifier into a folder, along with the meta_data.json file and, if necessary, the seg_info.json file.
The basic format allows you to provide metadata for the images and, if applicable, for the segmentations. This additional information is provided within two JSON files:
meta-data.json
seg-info.json
Example: Images without SEG:
If your data does not contain segmentations, the directory should be structured as follows:
├───OnlyMRs
│       Case00.nii.gz
│       Case02.nii.gz
│       Case03.nii.gz
│       meta_data.json
An exemplary meta_data.json could look like this:
meta_data.json

    {
        "global_tags": {
            "0008|0060": "MR"
        },
        "series_tags": {
            "Case00.nii": {
                "0008|103e": "I am unique"
            }
        }
    }
As shown in the example, the meta_data.json file allows you to set DICOM tags for the entire dataset using the "global_tags" field, and for each series using the "series_tags". The respective file path serves as the identifier.
Images with SEGs:
If your data also contains segmentations, the import pipeline will convert them and associate them with their respective volumes. Metadata specific to the segmentations is provided by the seg_info.json file. Here is a minimal example:
seg_info.json

    {
        "algorithm": "Ground truth",
        "seg_info": [
            {
                "label_name": "prostate",
                "label_int": "1"
            }
        ]
    }
The "algorithm" field specifies the algorithm or model used to create the segmentation. If the segmentation is provided by a clinician, use "Ground truth" as the value.
The "seg_info" field is a list that contains segmentation information for each segmented region or organ. Each block in the "seg_info" list includes the "label_name" field, which specifies the name of the region or organ,
and the "label_int" field, which represents the respective integer in the segmentation file. If the segmentation includes multiple regions, you need to add a block to the "seg_info" list for each region. You can use the following template as a basis:
seg_info_template.json (Todo check in code if this is all correct)

    {
        "task_body_part": "<optional - body part>",
        "algorithm": "<optional - algorithm name>",
        "seg_info": [
            {
                "label_name": "<label 1 name>",
                "label_int": "<label 1 encoding integer>"
            },
            {
                "label_name": "<label 2 name>",
                "label_int": "<label 2 encoding integer>"
            }

        ]
    }
You can use one of the following options to structure your data in a way that allows the parser to associate the cases with their respective segmentations:
Option One:

    ├───MRsWithSegmentationsSameFolder
    │       Case11.nii.gz
    │       Case11_segmentation.nii.gz
    │       Case12.nii.gz
    │       Case12_segmentation.nii.gz
    │       seg_info.json

Option Two:

    ├───MRsWithSegmentationsTwoFolders
    │   │   seg_info.json
    │   │
    │   ├───cases
    │   │       Case03.nii.gz
    │   │       Case04.nii.gz
    │   │
    │   └───segs
    │           Case03.nii.gz
    │           Case04.nii.gz
Images in nnU-Net v2 formatting:
Additonally to the described basic format, we also support the nnU-Net v2 format that was build upon the medical segmentation decathlon. This file format combines segmentation meta-data and general meta-data within one file calles dataset.json.
dataset.json

    {
        "description": "Left and right hippocampus segmentation",
        "file_ending": ".nii.gz",
        "labels": {
            "Anterior": 1,
            "Posterior": 2,
            "background": 0
        },
        "licence": "CC-BY-SA 4.0",
        "channel_names": {
            "0": "MRI"
        },
        "name": "Hippocampus",
        "numTraining": 260,
        "reference": " Vanderbilt University Medical Center",
        "relase": "1.0 04/05/2018"
    }
├───Dataset004_Hippocampus
│   │   dataset.json
│   │
│   ├───imagesTr
│   │       hippocampus_001_0000.nii.gz
│   │       hippocampus_003_0000.nii.gz
│   │       hippocampus_004_0000.nii.gz
│   │       hippocampus_006_0000.nii.gz
│   │
│   ├───imagesTs
│   │       hippocampus_002_0000.nii.gz
│   │       hippocampus_005_0000.nii.gz
│   │       hippocampus_009_0000.nii.gz
│   │       hippocampus_010_0000.nii.gz
│   │
│   └───labelsTr
│           hippocampus_001.nii.gz
│           hippocampus_003.nii.gz
│           hippocampus_004.nii.gz
│           hippocampus_006.nii.gz
Hint
Please note that the nnU-Net v2 format is particularly suitable for importing data with multiple channels per case. However, it is important to mention that the basic parser currently does not support this case.
If you want to import data with multiple channels per case, such as MRI data with FLAIR, T1w, T1gb, and T2w sequences, your data structure will look like this:
nnUNet_raw/Dataset001_BrainTumour/
├── dataset.json
├── imagesTr
│   ├── BRATS_001_0000.nii.gz
│   ├── BRATS_001_0001.nii.gz
│   ├── BRATS_001_0002.nii.gz
│   ├── BRATS_001_0003.nii.gz
│   ├── BRATS_002_0000.nii.gz
│   ├── BRATS_002_0001.nii.gz
│   ├── BRATS_002_0002.nii.gz
│   ├── BRATS_002_0003.nii.gz
│   ├── ...
├── imagesTs
│   ├── BRATS_485_0000.nii.gz
│   ├── BRATS_485_0001.nii.gz
│   ├── BRATS_485_0002.nii.gz
│   ├── BRATS_485_0003.nii.gz
│   ├── BRATS_486_0000.nii.gz
│   ├── BRATS_486_0001.nii.gz
│   ├── BRATS_486_0002.nii.gz
│   ├── BRATS_486_0003.nii.gz
│   ├── ...
└── labelsTr
    ├── BRATS_001.nii.gz
    ├── BRATS_002.nii.gz
    ├── ...
Datasets
Datasets form the core component for managing and organizing data on the platform. The features include:
An intuitive Gallery-style view for visualizing DICOM Series thumbnails and metadata (configurable).
Multiselect function for performing operations on multiple series simultaneously such as adding/removing to/from a dataset, executing workflows, or creating new datasets.
A configurable side-panel metadata dashboard for exploring metadata distributions.
Shortcut-based tagging functionality for quick and effective data annotation and categorization.
Full-text search for filtering items based on metadata.
A side panel series viewer using an adjusted OHIF Viewer-v3 to display DICOM next to the series metadata.
In the following sections, we delve into these functionalities.
Gallery View
With numerous DICOMs, managing them can be challenging. Taking cues from recent photo gallery apps, we’ve created a similar interaction model called the “Gallery View”. It displays a thumbnail of the series and its metadata, all of which is configurable via Settings. The Gallery View loads items on-demand to ensure scalability.
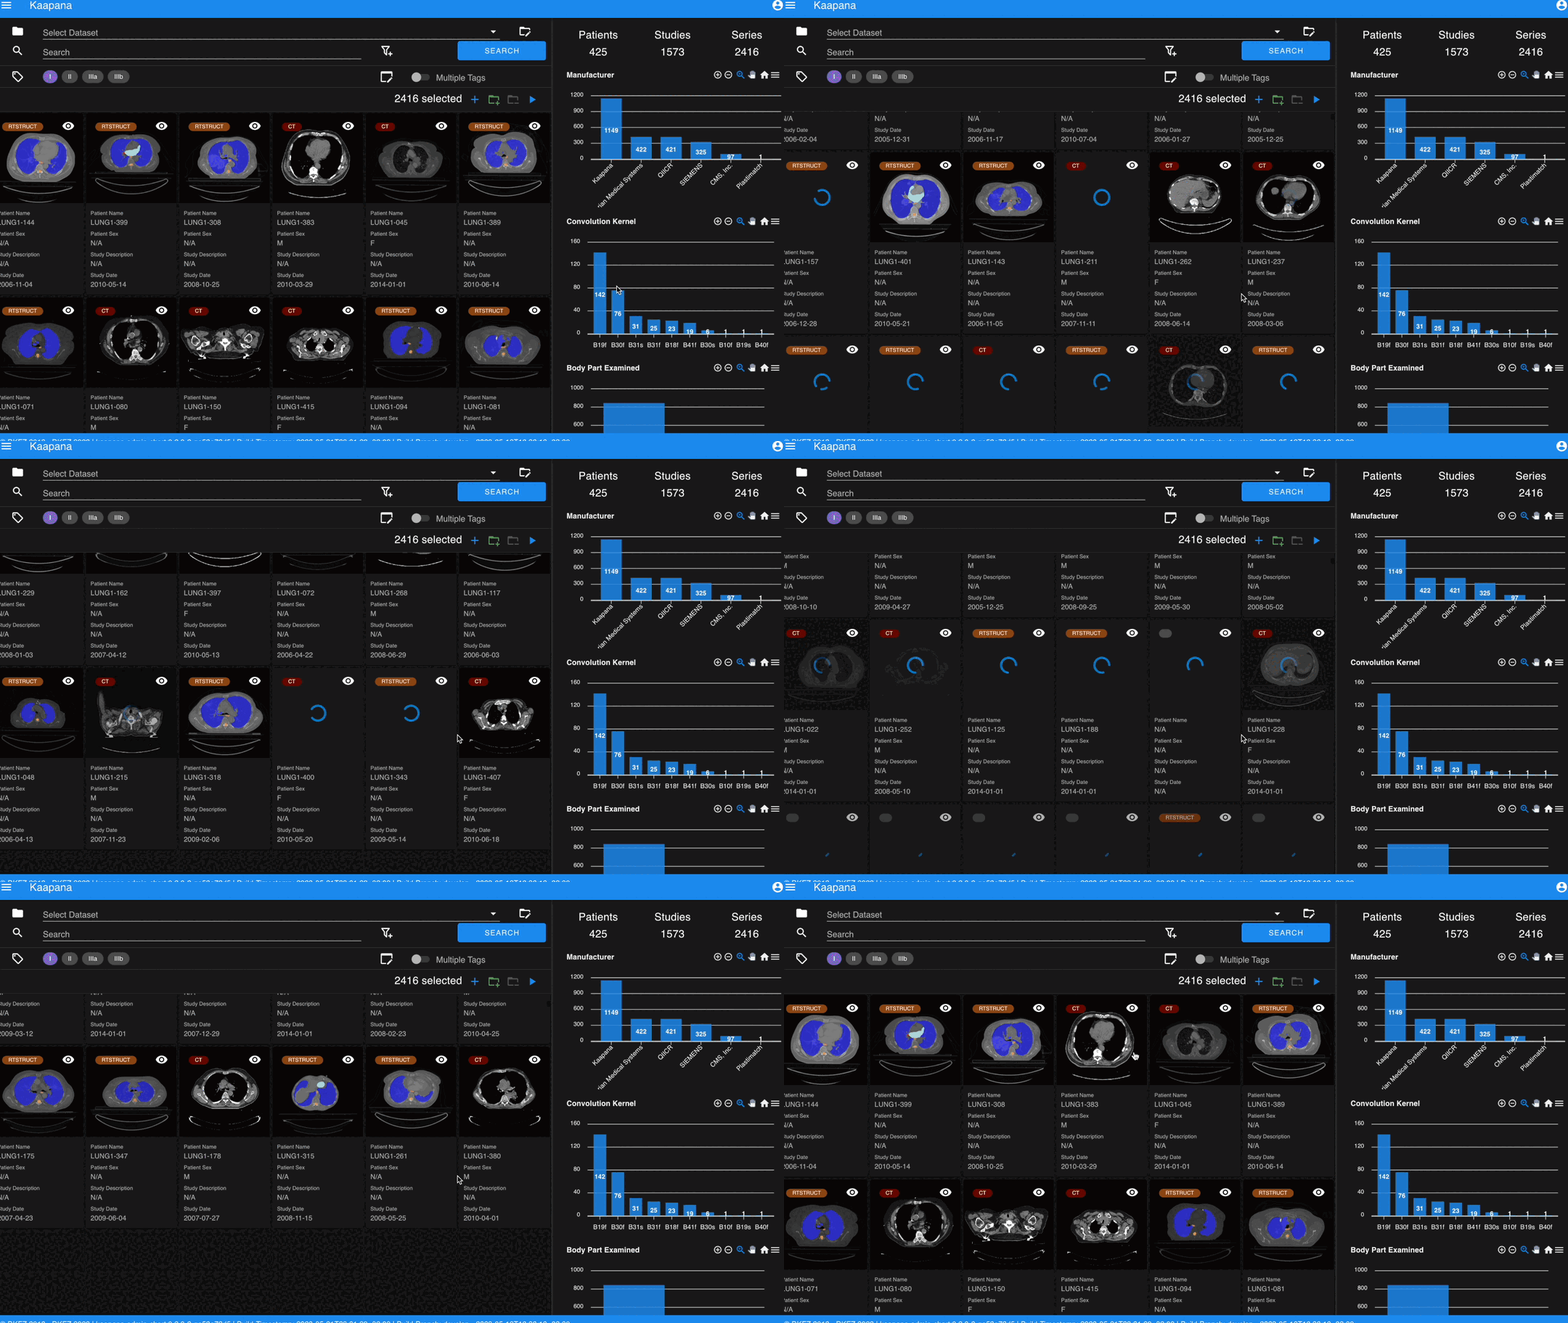
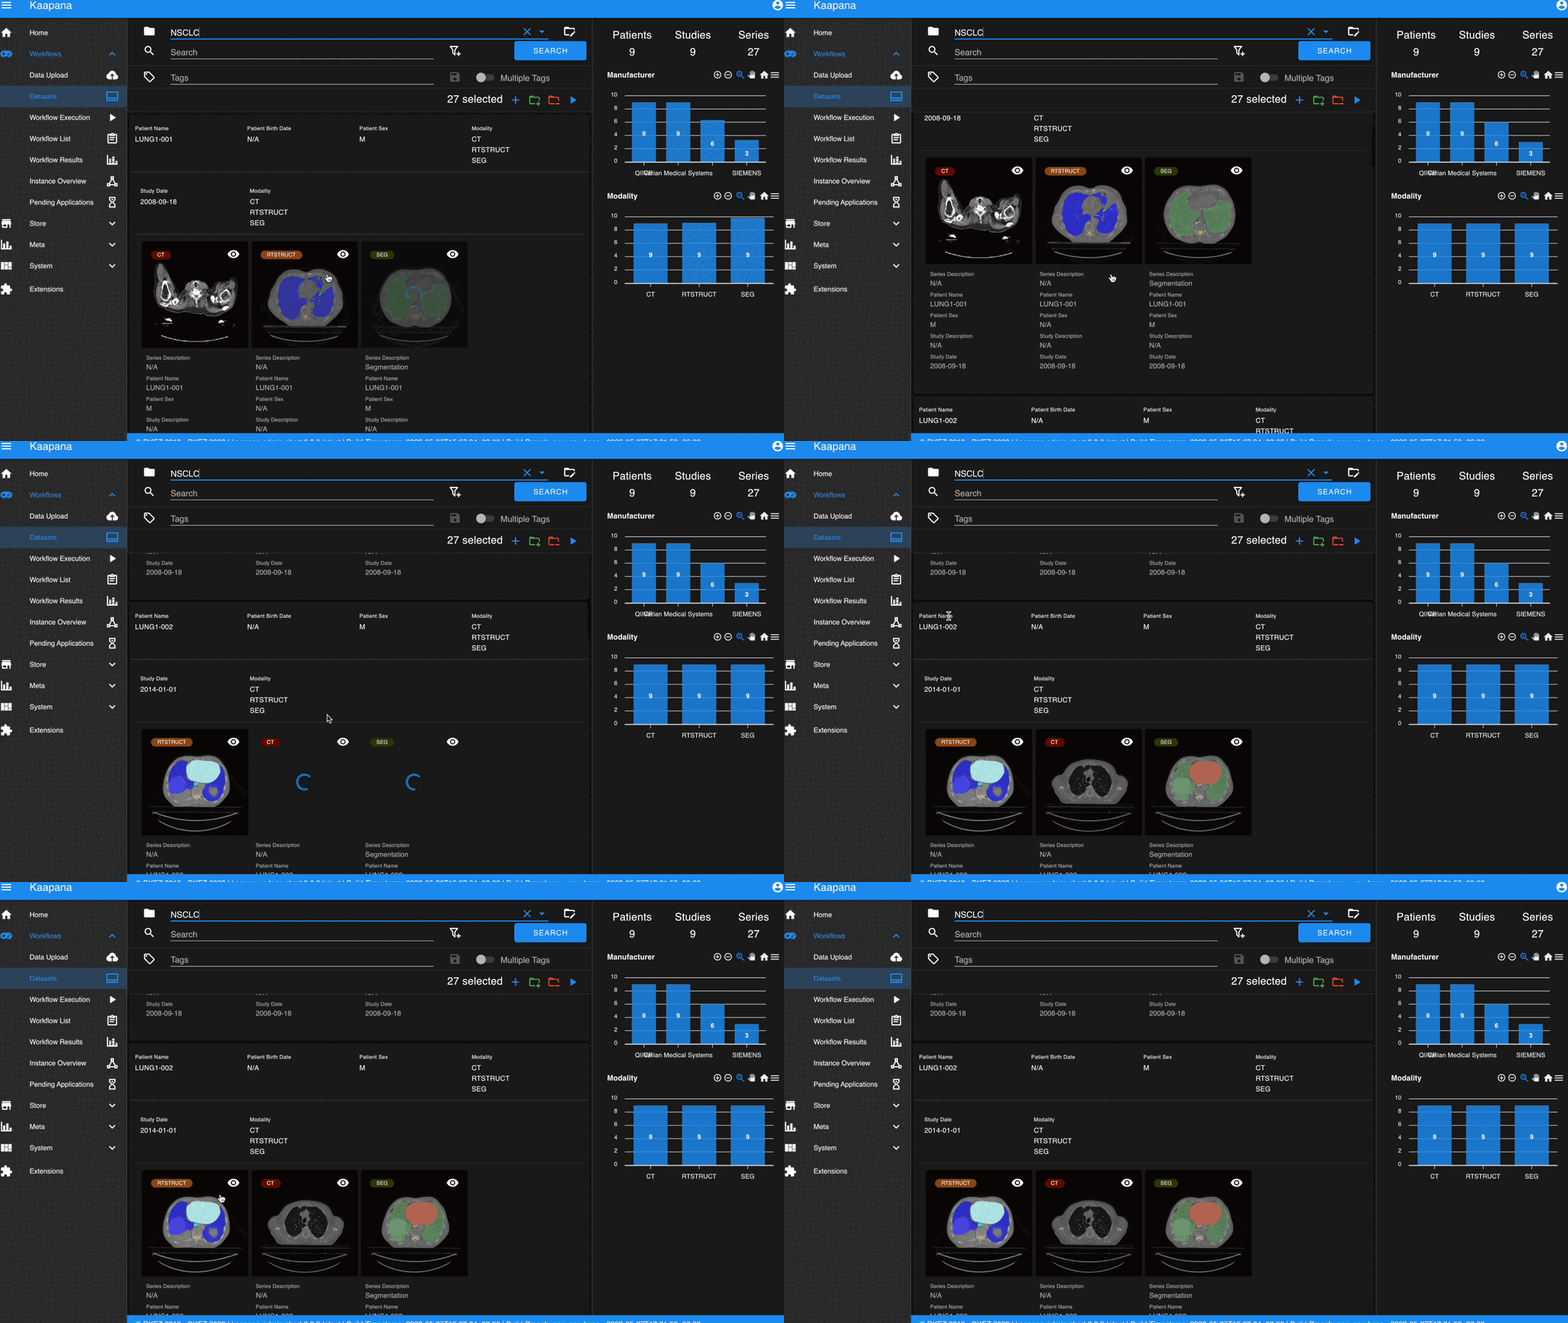
In some scenarios, you may wish to structure data by patient and study. This can be achieved through the Structured Gallery View, which can be enabled in Settings.
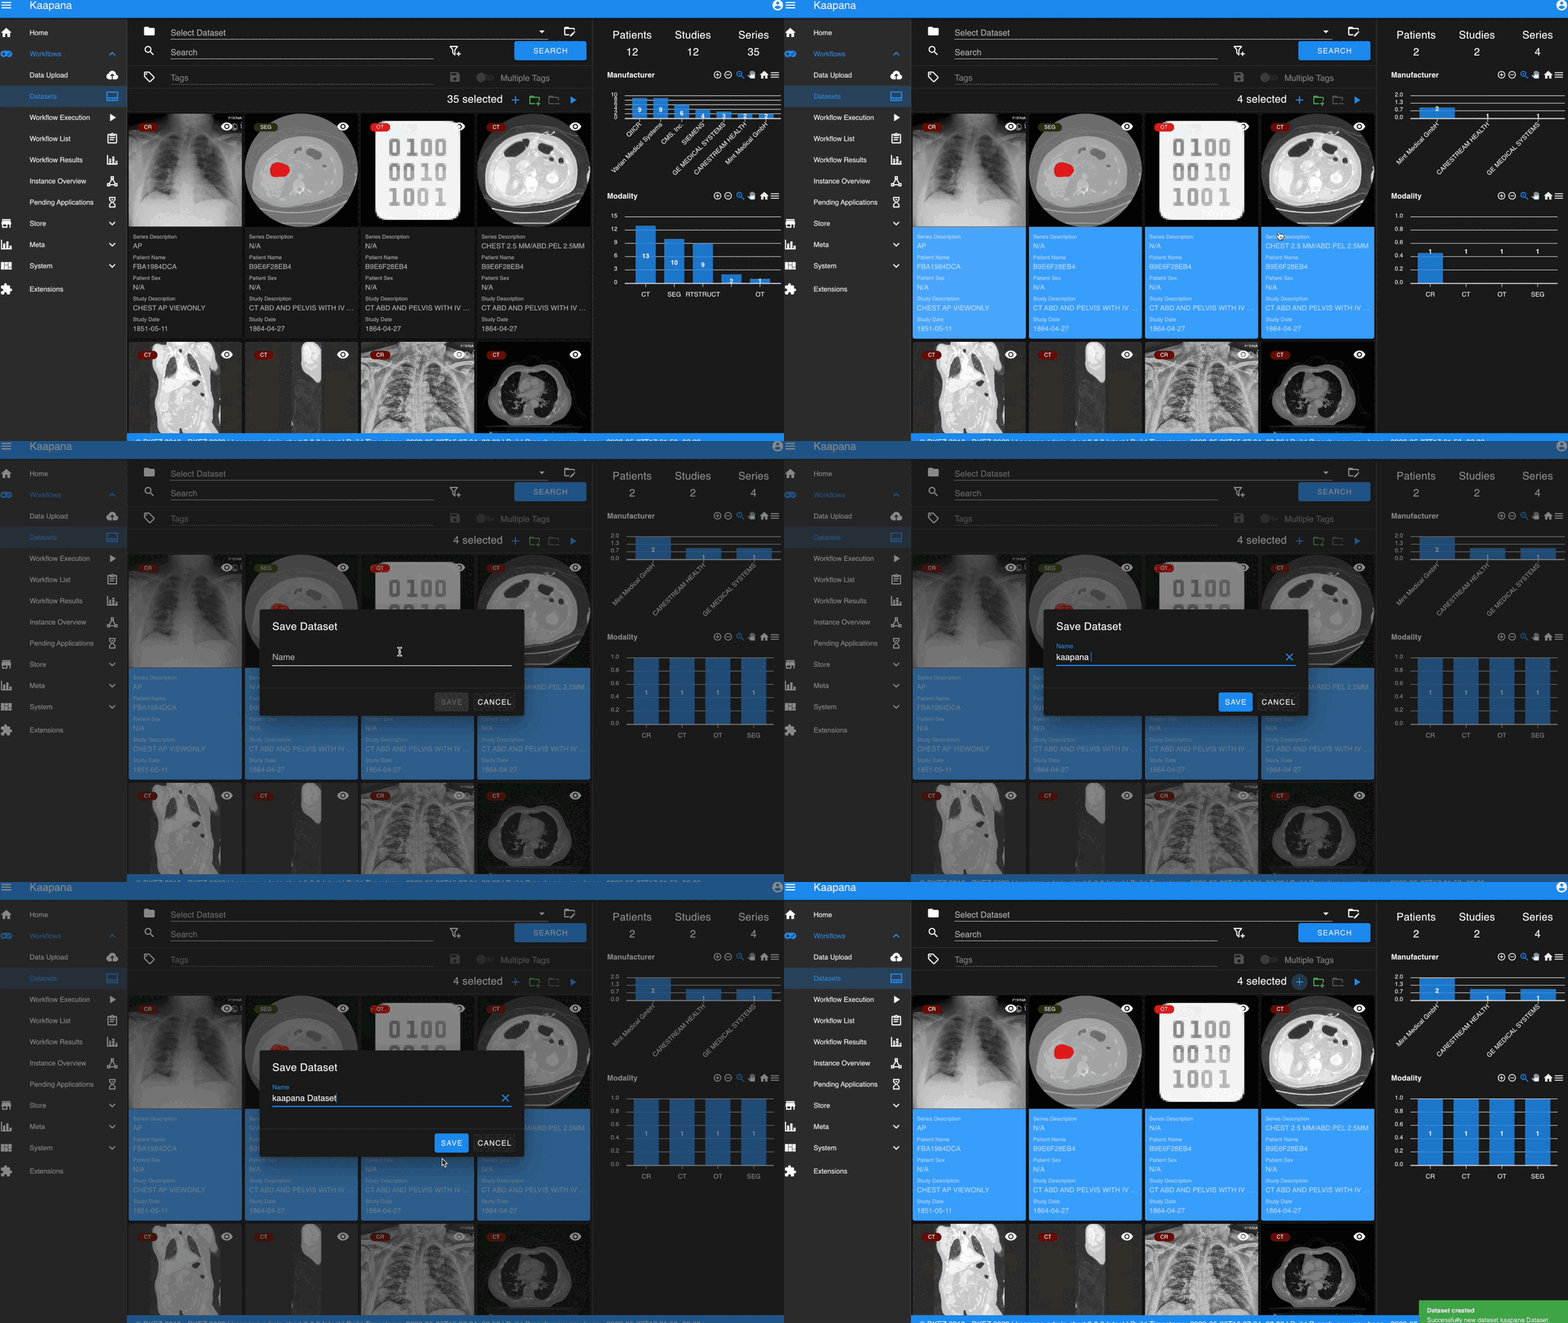
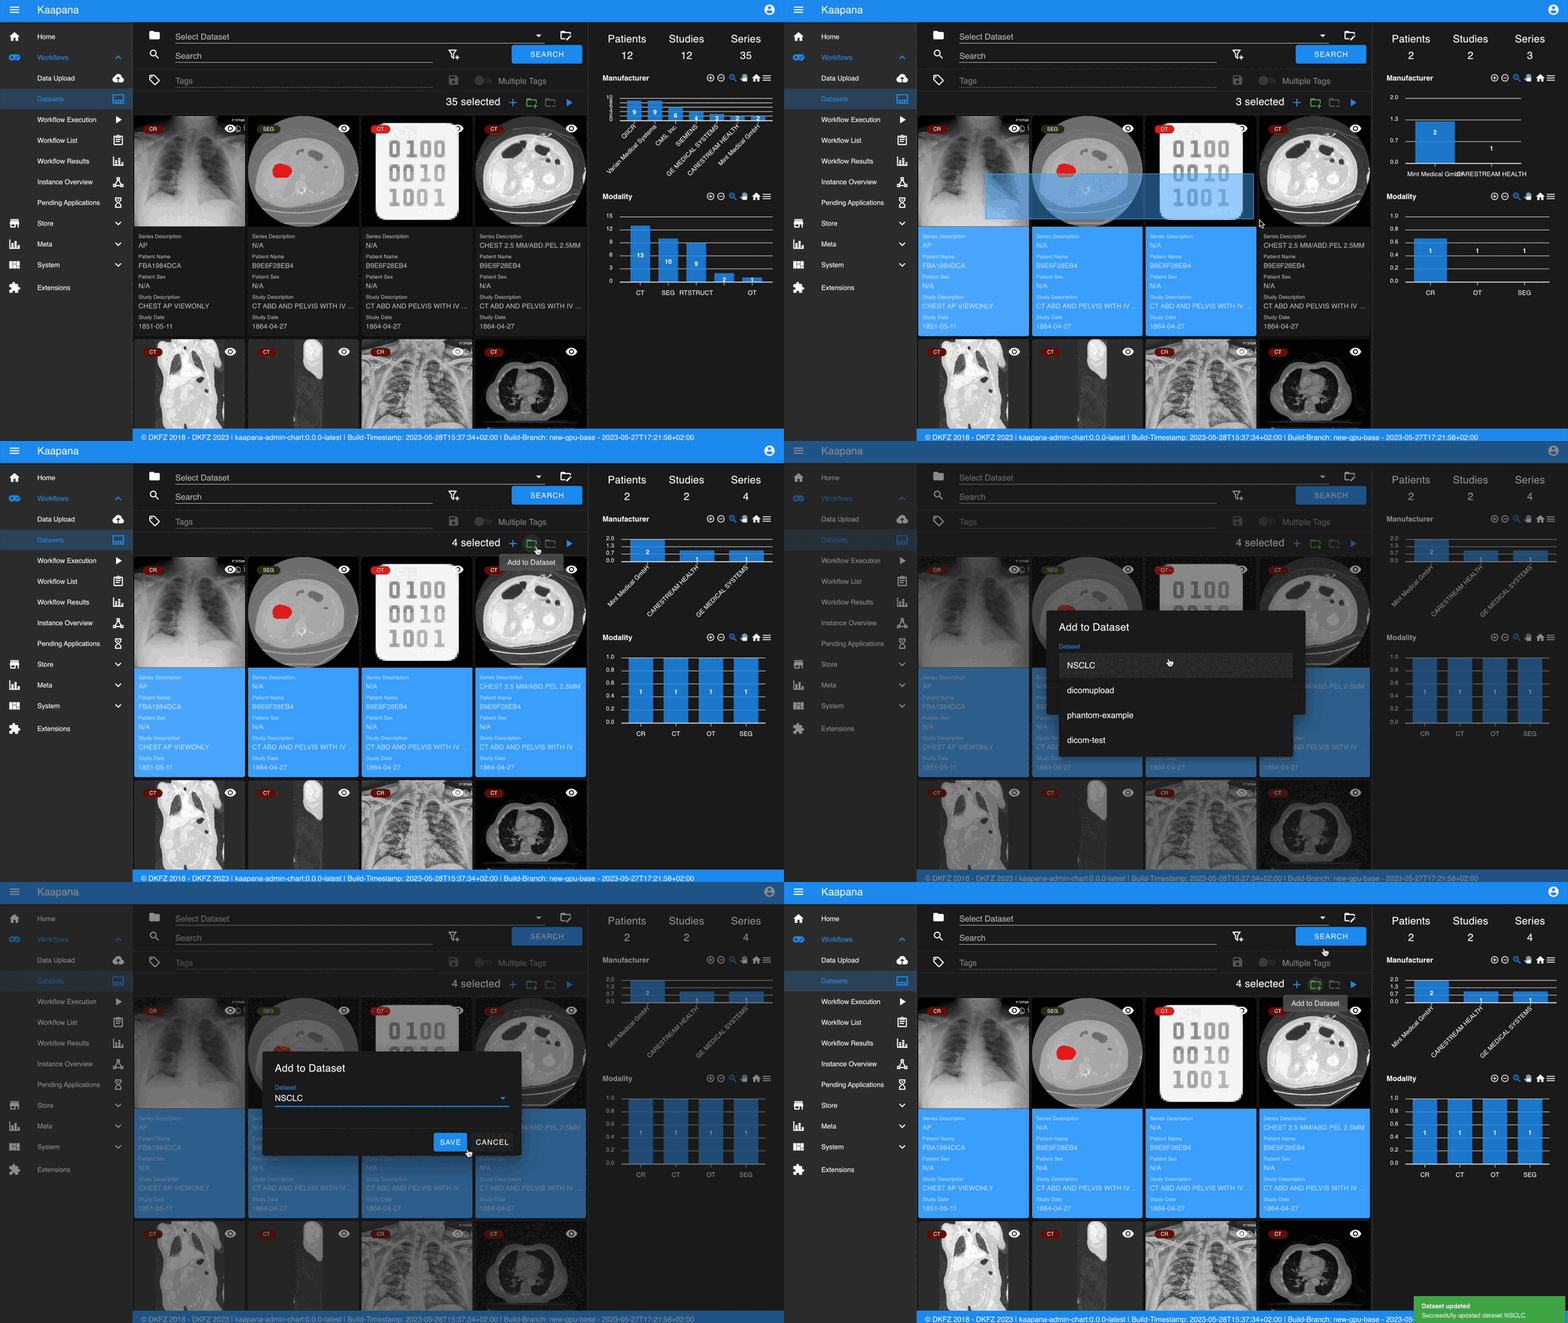
The Gallery View offers straightforward and intuitive data interaction via multi-select functionality. You can select multiple individual series by holding CTRL (CMD on MacOS) and clicking the desired series, or by using the dragging functionality.
After selecting, you have several options:
Create a new dataset from the selected data.
Add the selected data to an existing dataset.
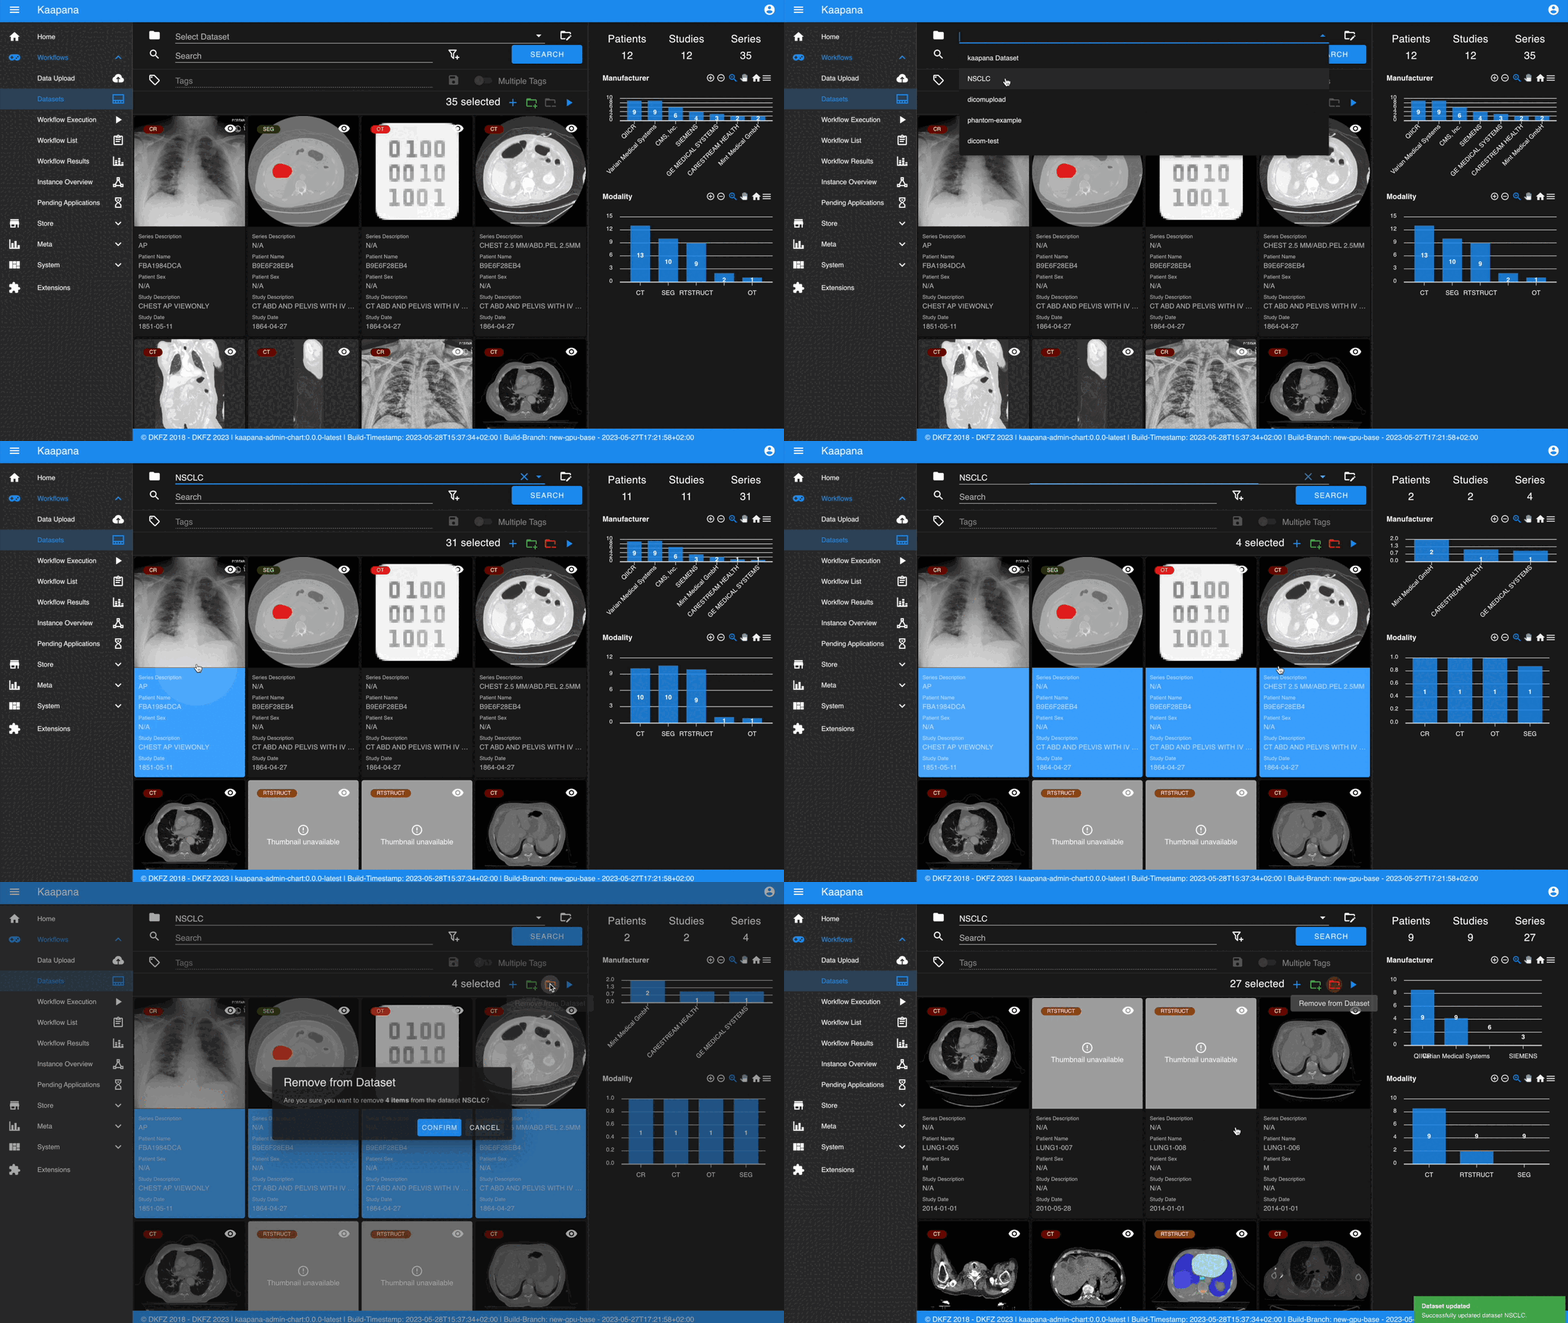
If a dataset is selected, remove the selected items from the currently selected dataset (this will not delete the data from the platform).
Execute a workflow with the selected data. Note that in this scenario, unlike in Workflow Execution, there is no explicit linkage to a dataset.

Note
Without an active selection, all items are selected. The ‘Items Selected’ indicator shows the number of items an action will be performed on.
Dataset Management and Workflow Execution
Interaction actions for the Gallery View are located above it. The first row is dedicated to selecting and managing datasets. Once a dataset is selected, the Gallery View will automatically update. A dataset management dialog, accessible from the same row, provides an overview of the platform’s datasets and enables deletion of unnecessary datasets.
Note
Deleting a dataset does not erase its contained data from the platform.
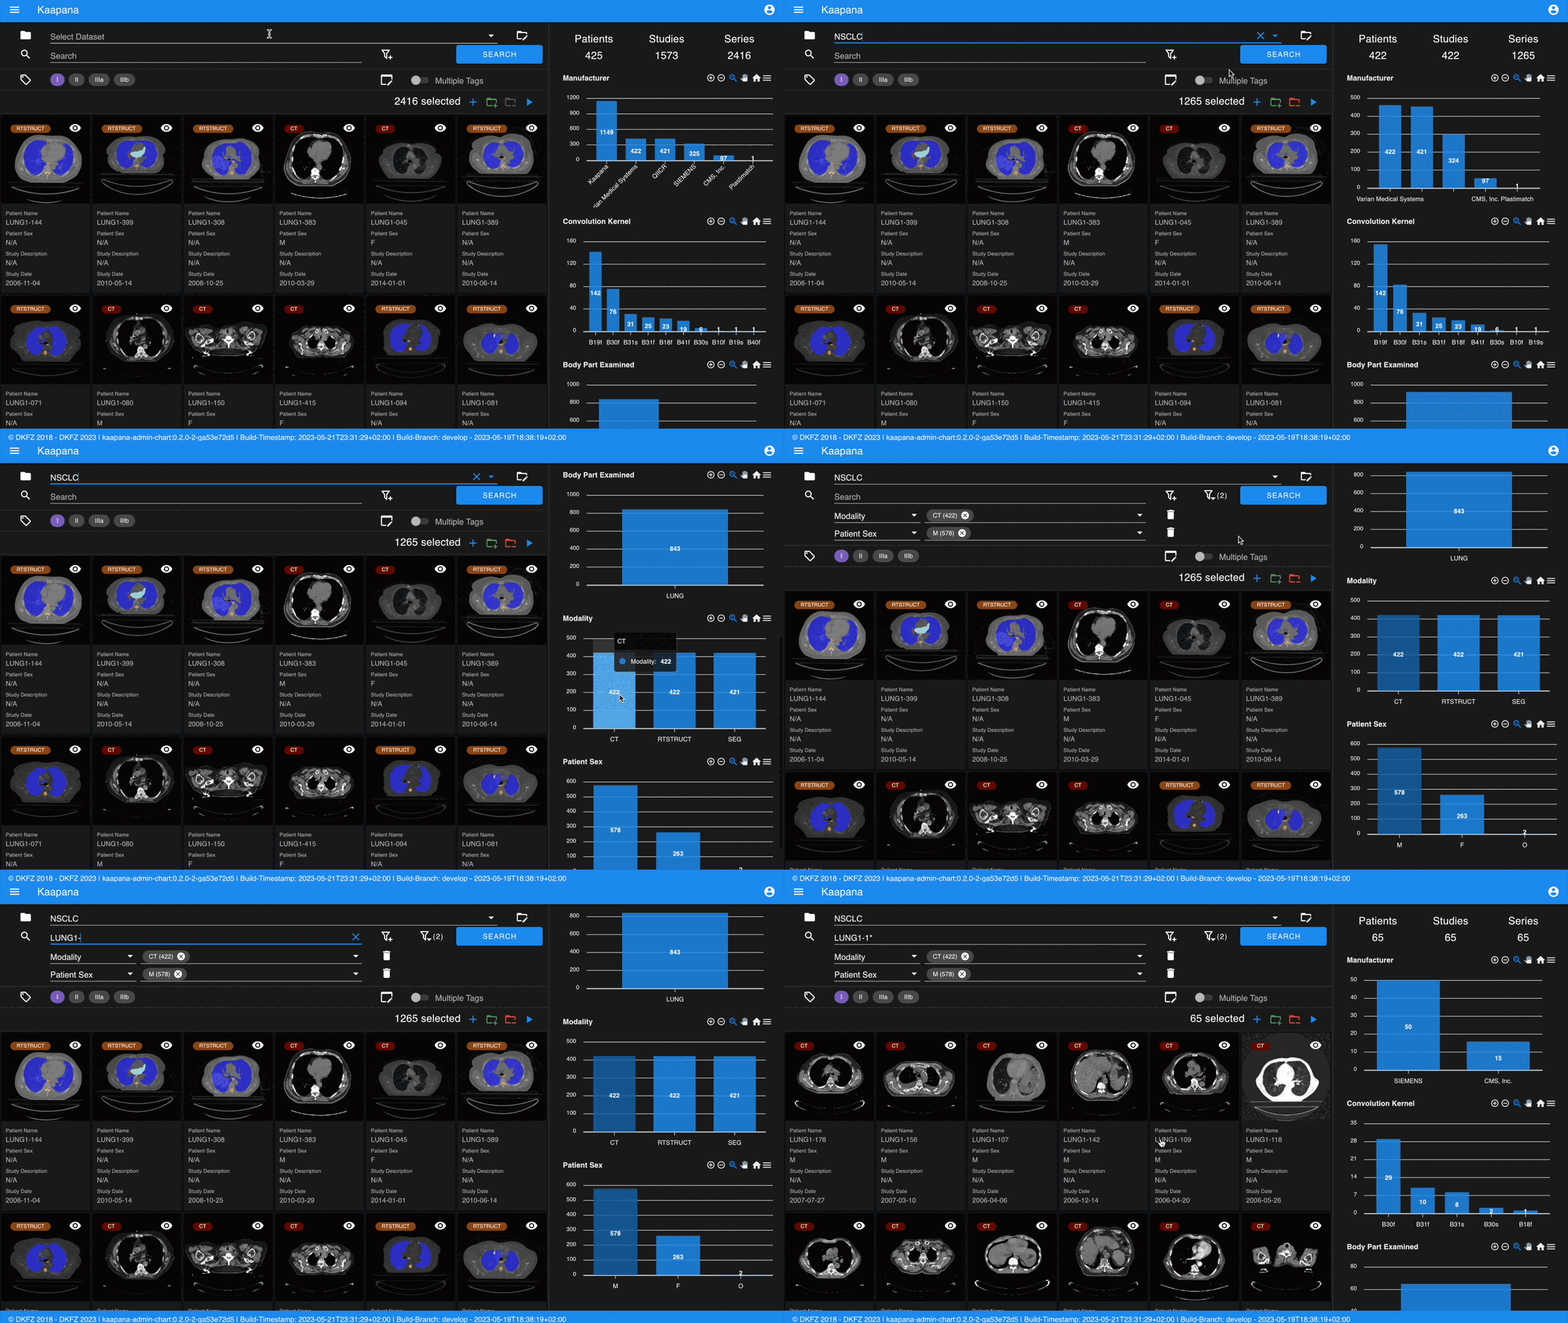
The second row is dedicated to filtering and searching. We offer a Lucene-based full-text search.
Note
Useful commands:
Use * for wildcarding, e.g., LUNG1-* shows all series with metadata starting with LUNG1-.
Use - for excluding, e.g., -CHEST excludes all series with metadata containing CHEST.
For more information, check the OpenSearch Documentation.
You can add additional filters for specific DICOM tags, with an autocomplete feature for convenience.
Note
Individual filters are combined with AND, while the different values within a filter are combined with OR.
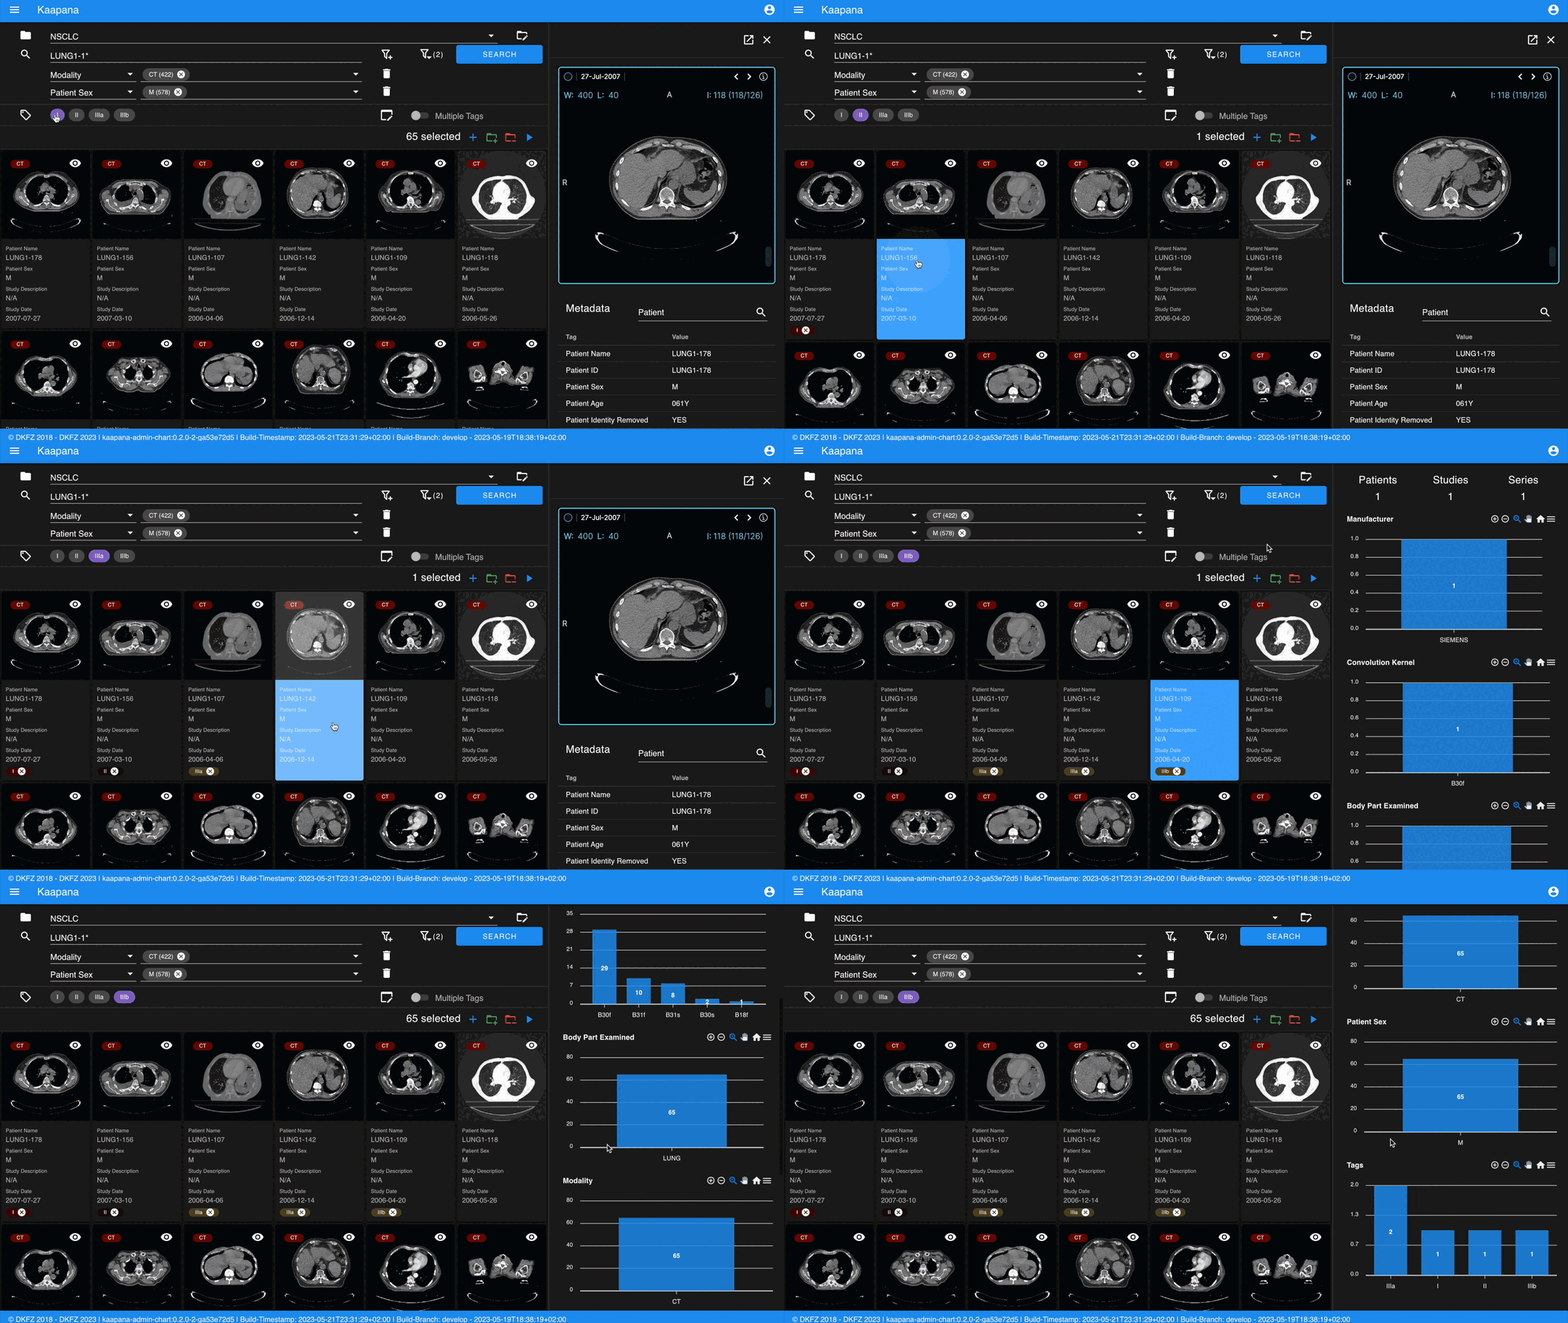
The following row handles tagging, a convenient way to structure data. Tags are free-text, but an autocomplete feature allows reusing existing tags. To tag a series, activate the tag(s) and then click on the series. The switch next to the tags enables tagging with multiple tags at once.
Note
Activate tags using shortcuts. Press 1 to toggle the first tag, 2 for the second, and so on.
If a series already has the currently active tag, clicking the series again will remove it. This also applies in multiple tags mode.
Remove tags by clicking the X next to the tag. (Note: Removing a tag this way will not update the Metadata Dashboard dashboard if it’s visualized there)
Metadata Dashboard
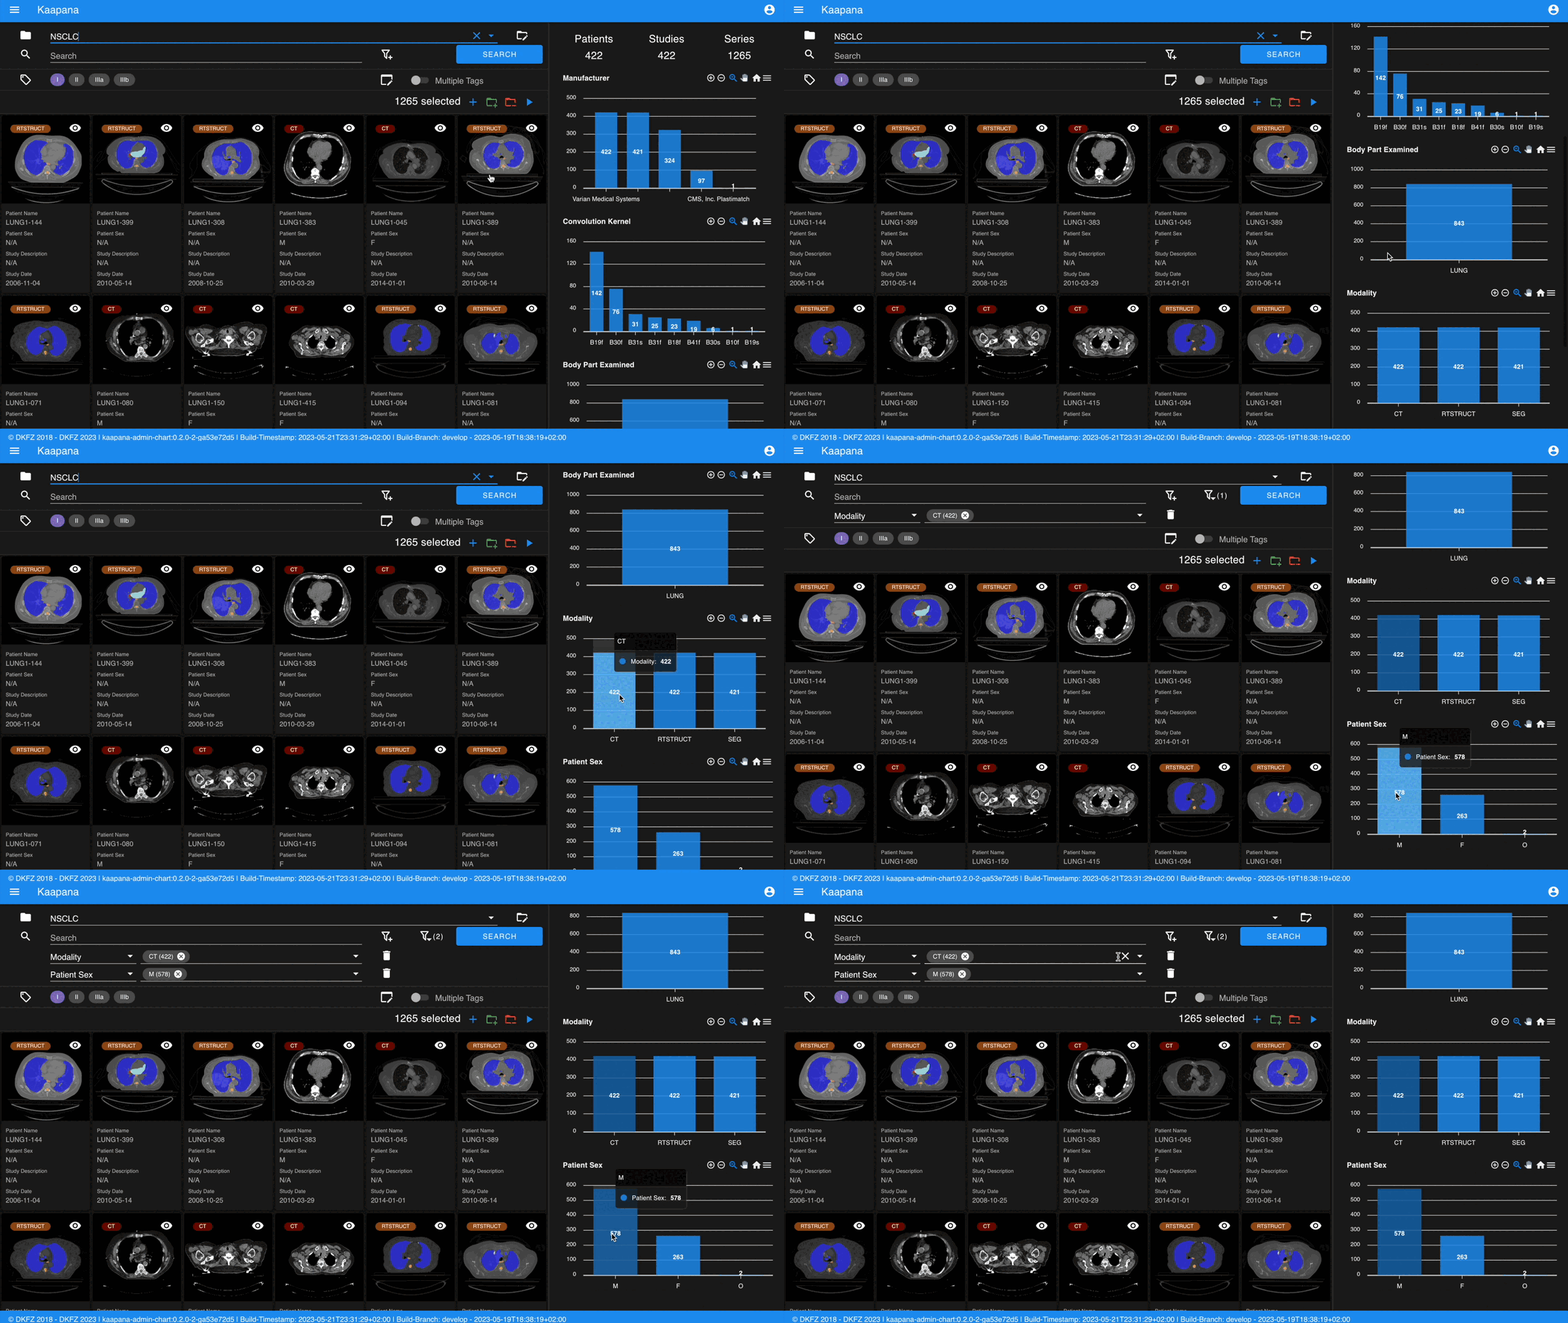
Next to the Gallery View is the Metadata Dashboard (configurable in Settings). This dashboard displays the metadata of the currently selected items in the Gallery View.
Note
Clicking on a bar in a bar chart will set the selected value as a filter. Click ‘search’ to execute the query.
Detail View
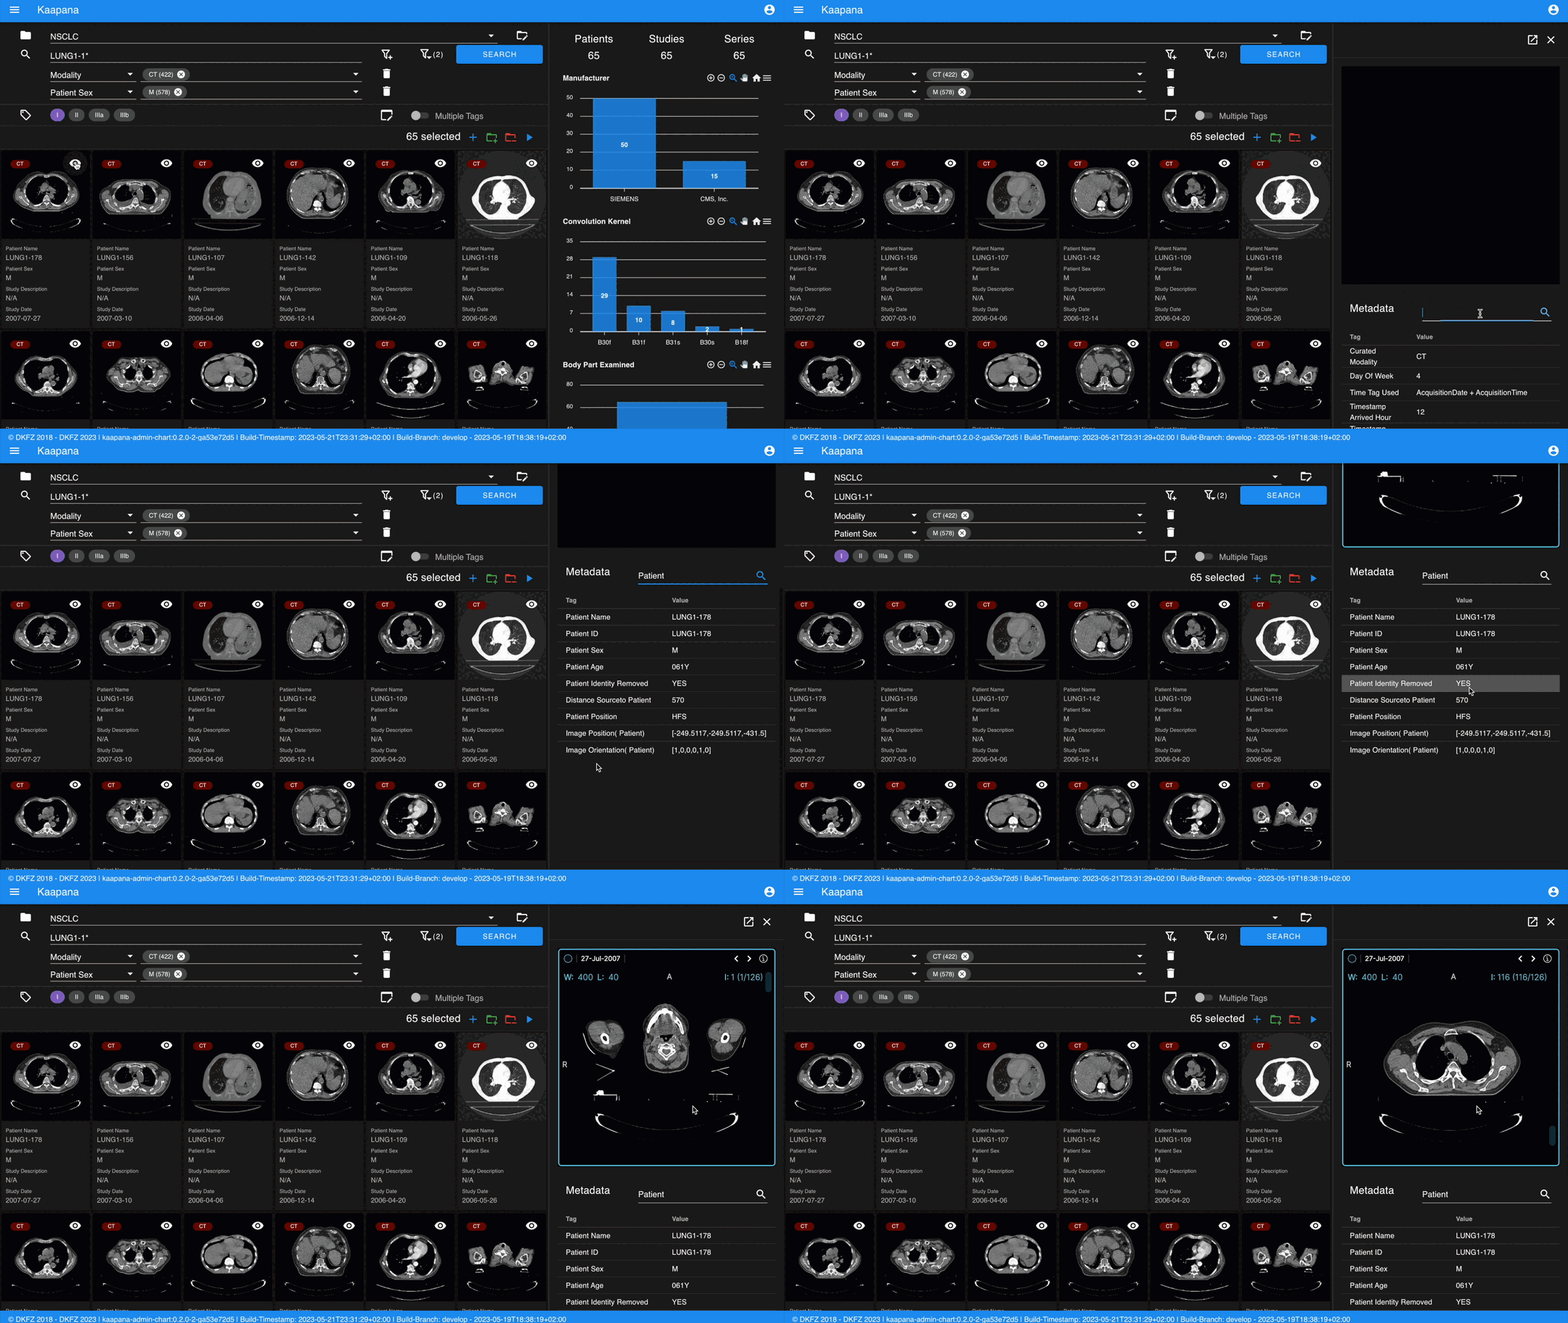
For a more detailed look at a series, double-click a series card or click the eye icon at the top-right of the thumbnail to open the detail view in the side panel. This view comprises an OHIF-v3 viewer and a searchable metadata table for the selected series.
Settings
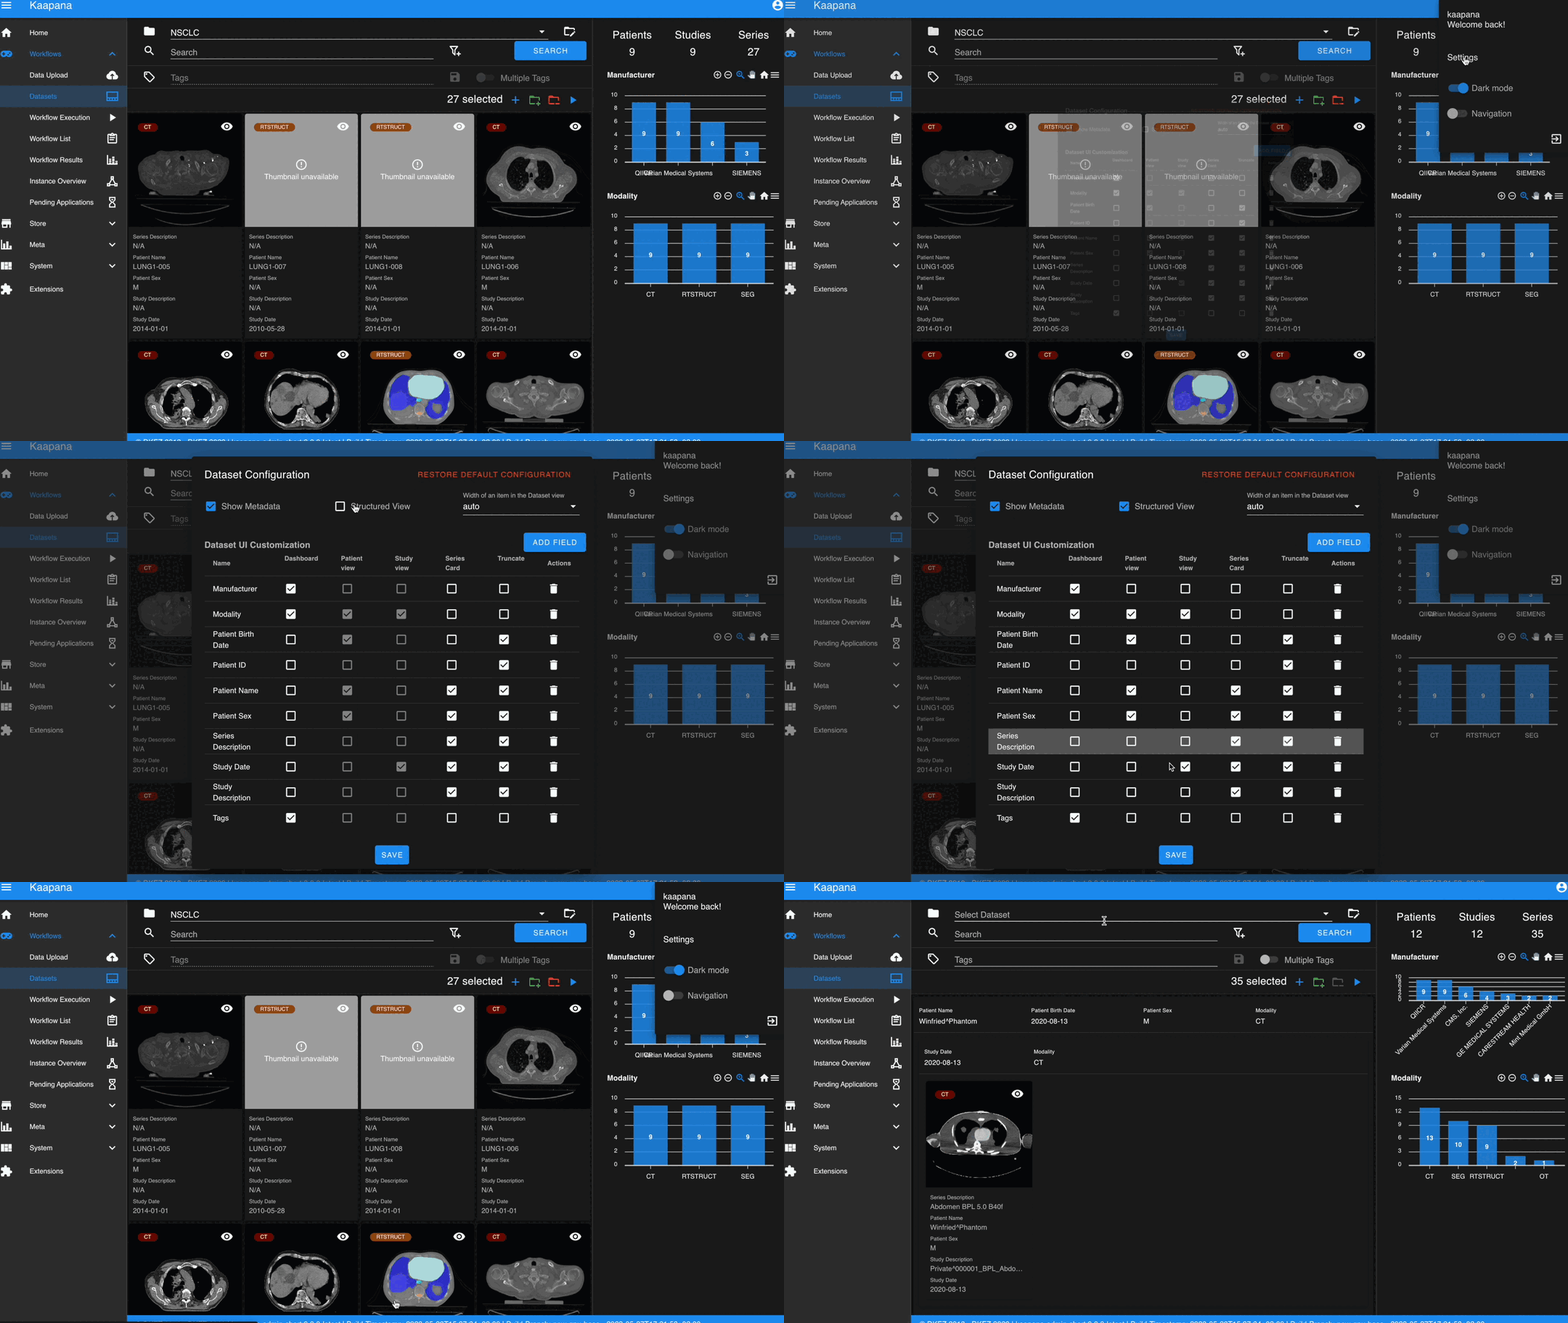
Settings can be found by clicking on the user icon in the top-right corner and then selecting ‘Settings’. A dialog will open.
The Dataset view is highly configurable. You can choose between the Gallery View and Structured Gallery View, decide how many items to display in one row, and determine whether to show just thumbnails or also series metadata.
For each field in the metadata, the following options are available:
Dashboard: Display aggregated metadata in the Metadata Dashboard
Patient View: Display values in the patient card (if the Structured Gallery View is enabled)
Study View: Display values in the series card (if the Structured Gallery View is enabled)
Series Card: Display values in the Series Card
Truncate: Limit values in the Series Card to a single line for visual alignment across series
Saving the settings will update the configuration and reload the page.
Note
For now, the configuration of Settings is only stored in the browser’s local storage. Implications:
Clearing the browser cache will restore the default settings
Different users logging in from the same computer will access the same settings
Logging in with the same user on different computers will load the default settings
Workflow Execution
The Workflow Execution component of the WMS serves to configure and execute workflows on the Kaapana platform. This component is the only location on the platform to start executable instances which will run as DAG-runs in Kaapana`s workflow engine Airflow. The Workflow Execution component can either be directly accessed from Workflows -> Workflow Execution or from the Datasets component. Workflows are configured in the following way:
specify runner instance(s), i.e. the instances on which jobs of the configured workflow should be executed. Thereby it is worth mentioning that remote and federated workflow executions are in the new WMS more built-in
select the Airflow-DAG which should be run and further configured with DAG-specific specification
select a dataset is selected with the data which should be processed within the workflow
Remote and Federated Workflow Execution
Workflows can be executed in the following ways:
Local execution: Workflow is orchestrated by the same instance that serves as runner instance.
Remote execution: Workflow is orchestrated by another instance that serves as a runner instance.
Federated execution: The workflows-orchestrating instance coordinates the execution of jobs on both local and remote instances. These jobs then report back data/information to the orchestrating instance. This mode is particularly useful for federated learning scenarios.
On the orchestrating instance a federated orchestration DAG has to be started which then automatically spawns up runner jobs on the workflow`s runner instances.
Both remote and federated executed workflows are triggered from the Workflow Execution component. Concerning remote and federated execution of workflows, it is worth mentioning that Kaapana provides several security layers in order to avoid adversarial attacks:
Each Kaapana platform has a username and password-protected login
The registration of remote instances is handled by the instance name and a random 36-char token
Each remote/federated communication can be SSL verified if configured
Each remote/federated communication can be fernet encrypted with a 44-char fernet key if configured
For each Kaapana platform, the user can configure whether the local instance should check automatically, regularly for updates from connected remote instances or only on demand
For each Kaapana platform, the user can configure whether the local instance should automatically execute remote/federated workflow jobs which are orchestrated by a connected remote instance
If automatic execution is not allowed, remote/federated workflows will appear in the Workflow List with a confirmation button
Remote/federated workflow jobs can always be aborted on the runner instance to give the user of the runner instance full control about her/his instance
Workflow List
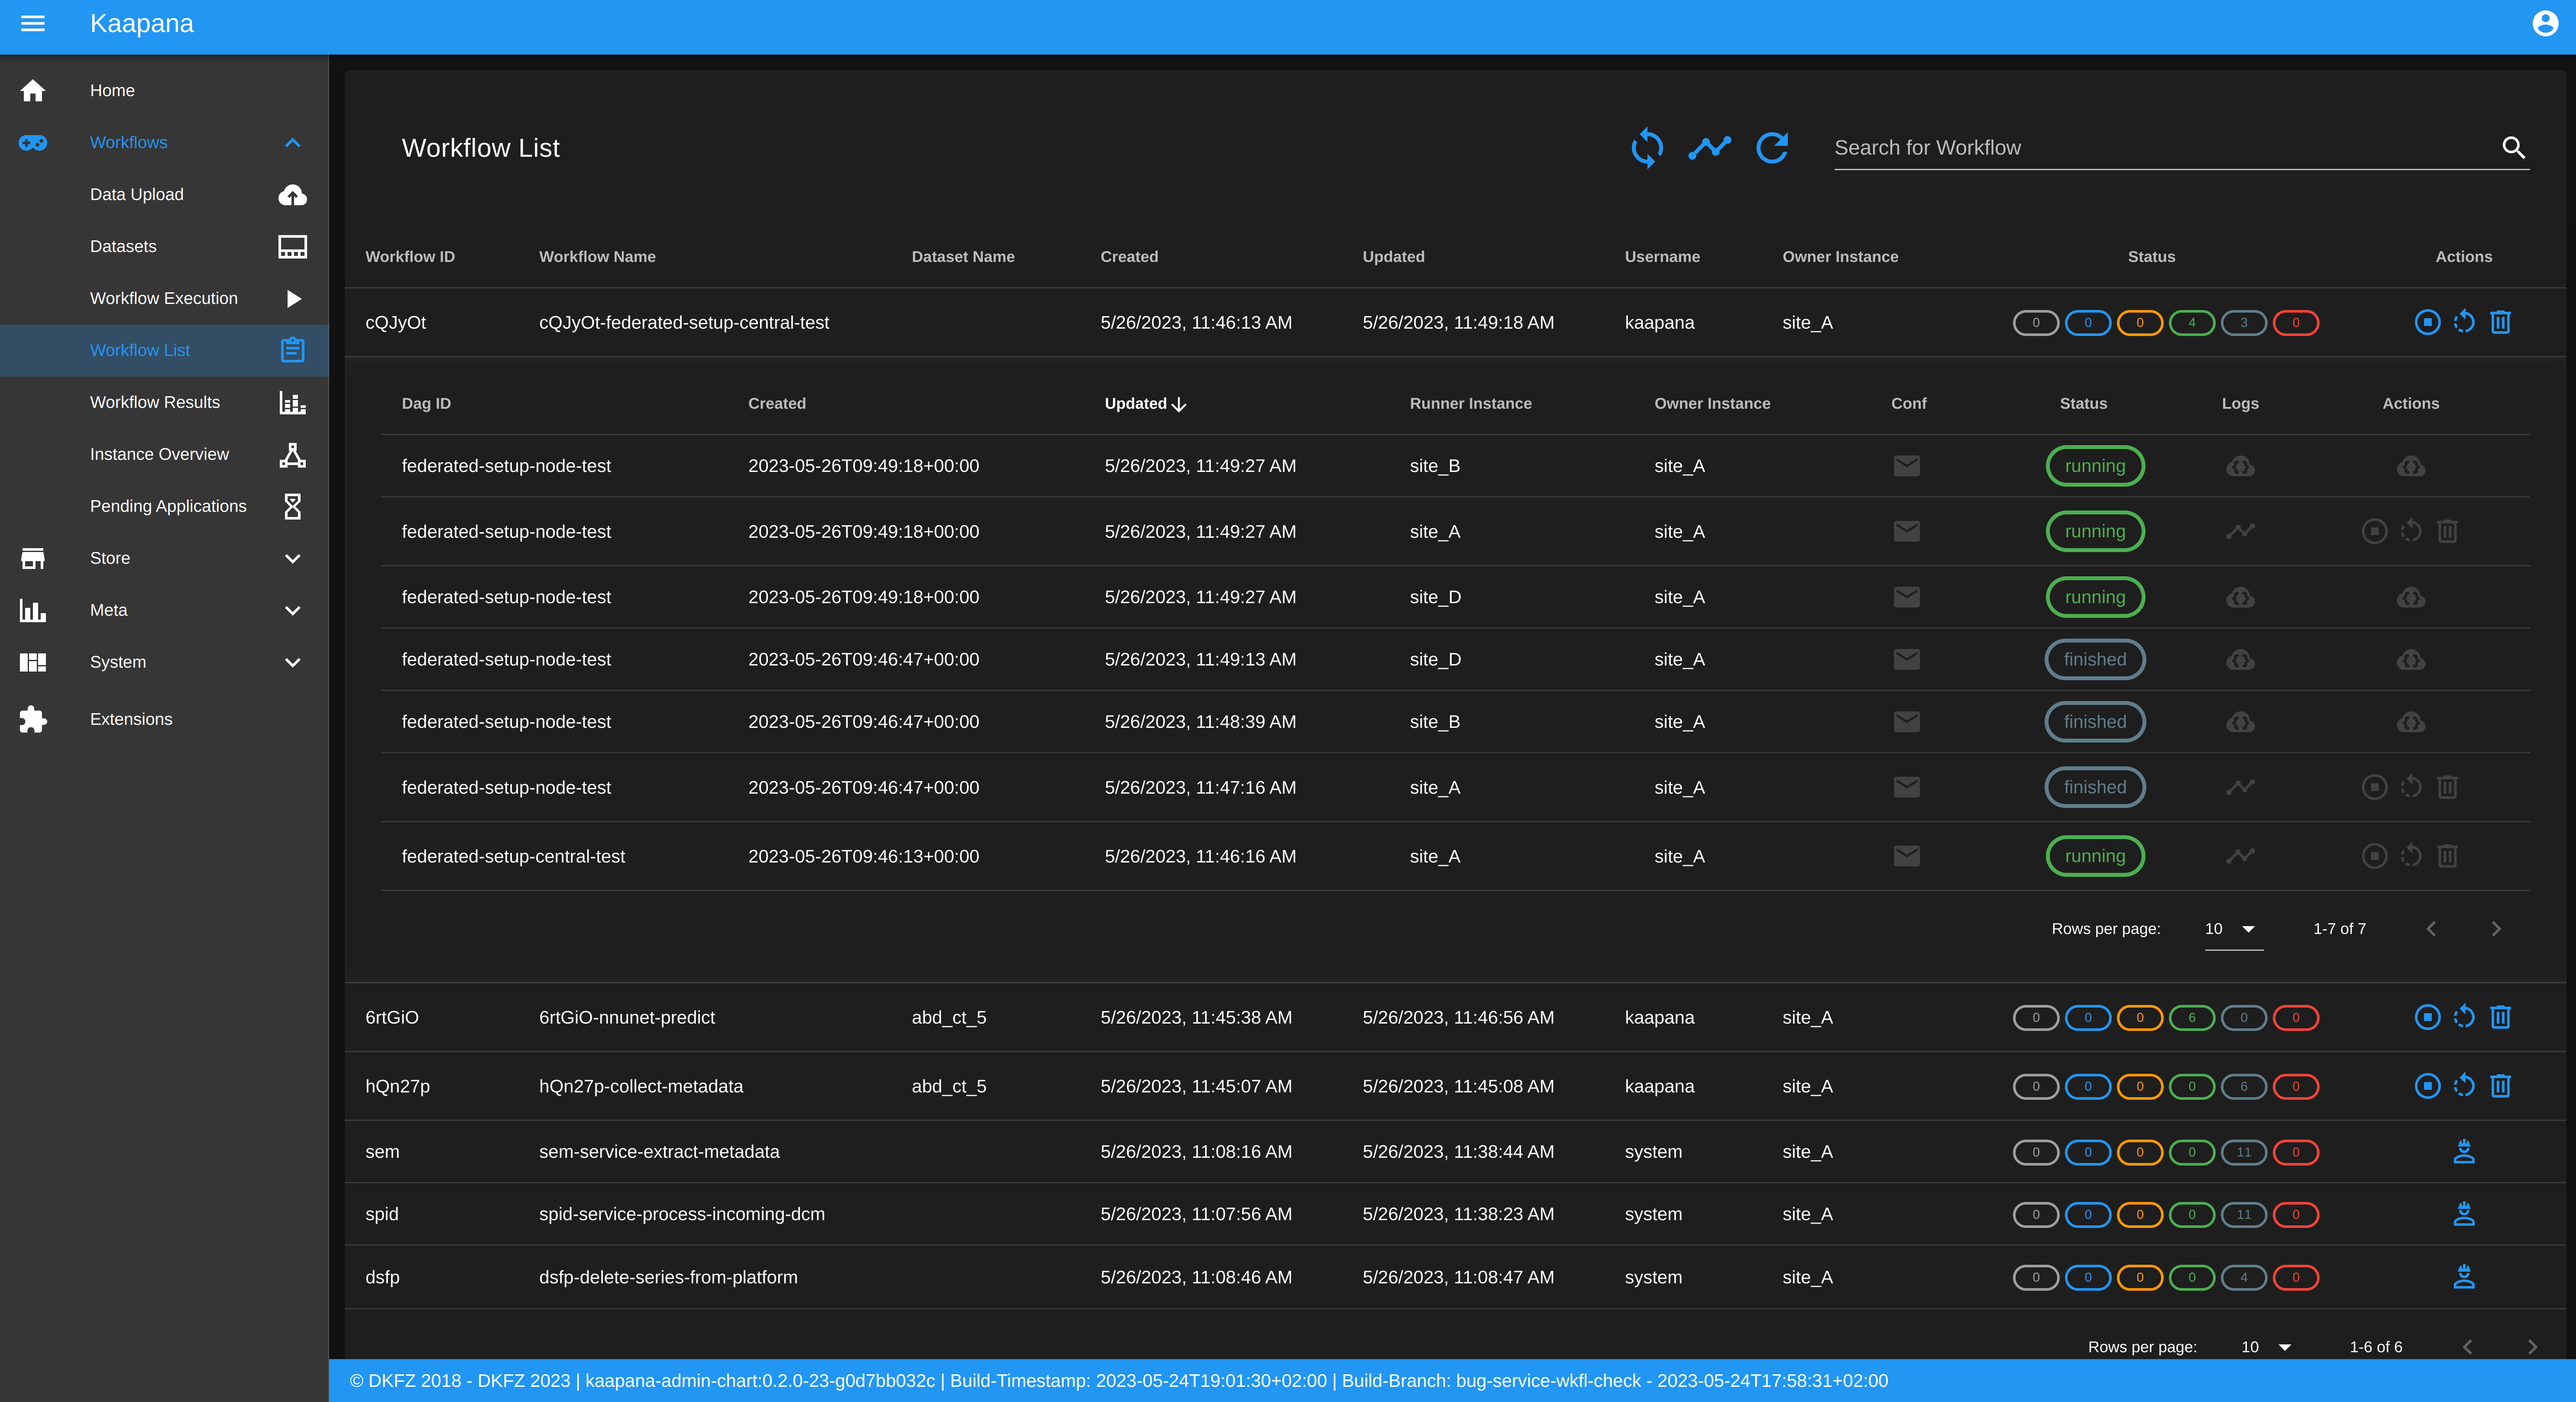
The Workflow List component allows users to visualize all workflows that are currently running or have previously run on the platform. The Workflow List comes with the following features:
comprehensive information regarding the specification of each workflow: workflow name, workflow UUID, dataset, time of workflow creation and time of last workflow update, username, owner instance
live status updates on the jobs associated with each workflow
set of workflow actions that users can perform, including the ability to abort, restart, or delete workflows and all their associated jobs
Each row of the Workflow List, which represents one workflow, can be expanded to further present all jobs which are associated with the expanded workflow. This list of job list comes with the following features:
comprehensive information regarding the specification of each job: ID of Airflow-DAG, time of job creation and time of last job update, runner instance, owner instance (= owner instance of workflow), configuration object, live updated status of the job
redirect links to the job’s Airflow DAG run to access additional details and insights about the job’s execution
redirect links to the Airflow logs of the job’s failed operator for troubleshooting and understanding the cause of the failure
set of job actions that users can perform, including the ability to abort, restart, or delete jobs
Service-workflows
In addition to regular workflows, the Workflow Management System (WMS) also visualizes background services within the platform. These services, such as pipelines triggered whenever a DICOM image arrives, are represented as service workflows accompanied by service jobs. By incorporating these service workflows into the visualization, users can easily track and monitor the execution of these important background processes within the platform.
Instance Overview
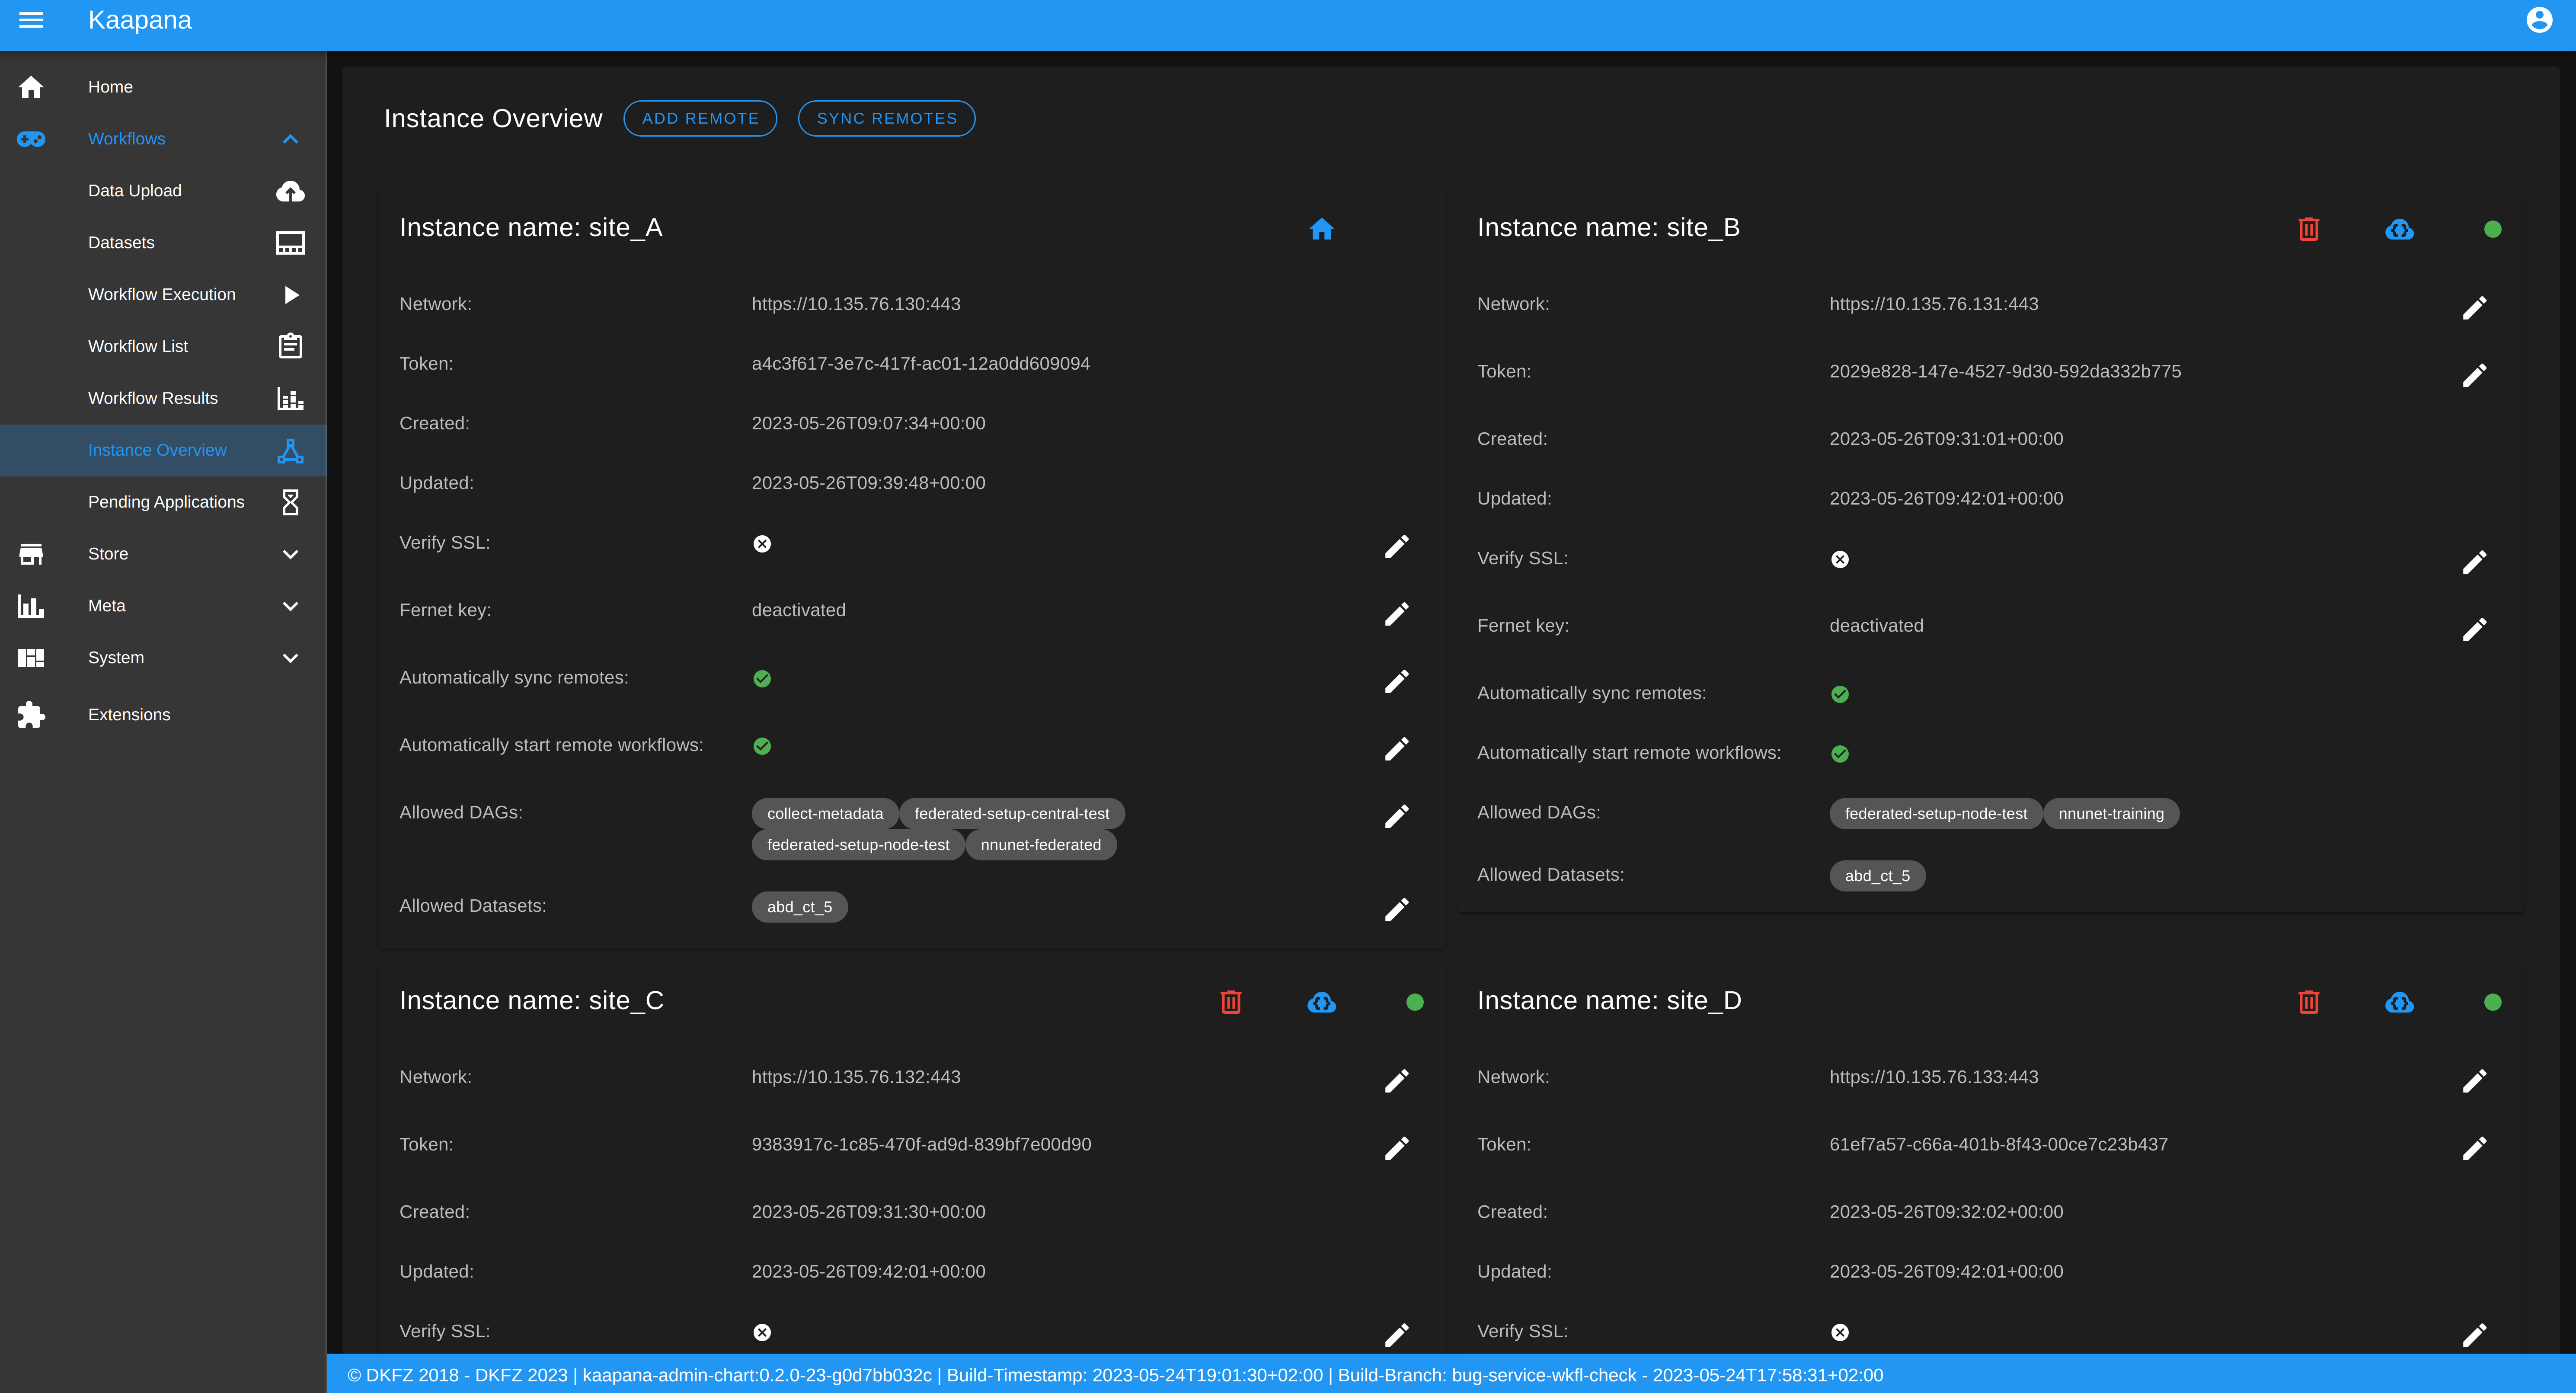
The Instance Overview component mainly serves to manage the local instance and its behaviour in a remote/federated workflow execution federation as well as the management of connected remote instances.
Local instance
comprehensive information regarding the specification of the local instance: instance name, network including protocol and port, token to establish a secure connection to remote instances, time of instance creation and time of last instance update
configurations which are used in the remote/federated workflow execution can be defined and modified:
SSL verification and fernet encryption for remote/federated communication
remote/federated syncing and execution privileges
permissions for the remote/federated usage of Airflow DAGs and datasets
Since the main aim of the Instance Overview component is the usage of the local Kaapana instance in a federation, the presented component also offers the possibility to add remote instances, which are described in the following. When it comes to connecting instance, there are a few important things to take care of:
instance names have to be unique in a federation of connected instances
when registering a remote instance you have to specify the remote instance`s name, network, token and fernet key exactly the same as these attributes are set on the remote instance itself
Remote instances
comprehensive information regarding the specification of the local instance: instance name, network including protocol and port, token to establish a secure connection to remote instances, time of instance creation and time of last instance update, SSL verification, fernet encryption, configurations of the connection remote instance regarding remote/federated syncing and execution privileges and permissions for the remote/federated usage of Airflow DAGs and datasets
on the local instance, the user can define and modify the following specifications of remote instances: port of the network, token, SSL verification and fernet encryption
